Data Science & Analytics

YouTube Analytics

Comprehensive analysis of YouTube statistics for data science and AI-related content, examining trends, patterns, and changes in viewer engagement over time using API data collection, statistical analysis, and hypothesis testing.

YouTube Analytics Dashboard

Project Overview

This project investigates trends in data science and AI-related videos on YouTube through comprehensive statistical analysis. Using the YouTube API, I collected and analyzed video statistics to answer the primary research question: "Has there been any change in the trend of data science and AI-related videos on YouTube?"

The analysis combines data collection, preprocessing, exploratory data analysis, and rigorous statistical testing to provide evidence-based insights into content performance and viewer engagement patterns over time.

Research Question

  • Primary Question – Has there been any change in the trend of data science and AI-related videos on YouTube?
  • Statistical Approach – ANOVA testing to compare means across different time periods
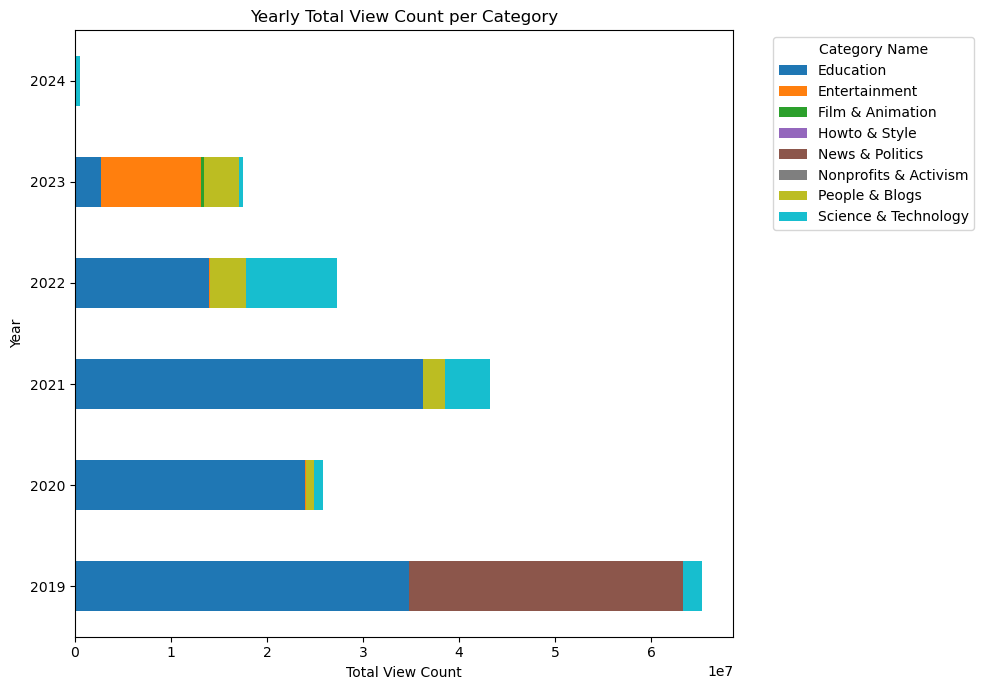
  • Metrics Analyzed – View counts, like counts, comment counts, and engagement rates
  • Time Scope – Multi-year analysis to identify temporal patterns and changes

Methodology

Systematic approach to data collection, processing, and analysis

Data Collection

Utilized YouTube Data API v3 to systematically collect video statistics for data science and AI-related content, implementing robust API calls with proper authentication and rate limiting.

Data Preprocessing

Comprehensive data cleaning including handling null values, removing duplicates, extracting dates, and creating additional features for temporal analysis and statistical testing.

Exploratory Analysis

In-depth EDA using statistical summaries, distribution analysis, correlation studies, and time series visualizations to identify patterns and trends in the data.

Statistical Testing

Applied ANOVA testing with proper assumption checks including normality, homogeneity of variance, and independence to validate findings with statistical rigor.

Analysis Components

Detailed breakdown of the analytical framework and key insights

Numerical Analysis

  • Summary statistics for all key metrics
  • Distribution analysis using histograms and KDE plots
  • Correlation analysis between views, likes, and comments
  • Outlier detection and treatment strategies

Temporal Analysis

  • Yearly and monthly trend visualization
  • Time series decomposition
  • Seasonal pattern identification
  • Change point detection

Categorical Analysis

  • Category-wise performance comparison
  • Content type effectiveness analysis
  • Engagement pattern classification
  • Performance ranking and segmentation

Statistical Validation

  • Hypothesis formulation and testing
  • ANOVA with post-hoc analysis
  • Effect size calculation
  • Statistical significance interpretation

Key Findings

Statistical Significance

ANOVA testing revealed statistically significant differences in video performance metrics across years.

  • Significant changes in mean view counts between years
  • Notable variations in like and comment engagement
  • Evidence of declining trend in recent periods

Trend Analysis

Overall decreasing trend in data science and AI video performance on YouTube platform.

  • Declining average view counts over time
  • Reduced engagement rates in recent years
  • Market saturation effects observed

Insights

Multiple factors potentially contributing to observed trends including algorithm changes and market dynamics.

  • YouTube algorithm evolution impacts
  • Increased competition in educational content
  • Shifting viewer preferences and behaviors

Technology Stack

Tools and technologies used for data collection, analysis, and visualization

Data Collection

  • YouTube Data API v3 - Video statistics retrieval
  • Python Requests - API interaction and authentication
  • JSON Processing - Data format handling

Data Processing

  • Pandas - Data manipulation and cleaning
  • NumPy - Numerical computations
  • DateTime - Temporal data handling

Statistical Analysis

  • SciPy - Statistical testing and ANOVA
  • Statsmodels - Advanced statistical modeling
  • Scikit-learn - Data preprocessing utilities

Visualization

  • Matplotlib - Statistical plotting and charts
  • Seaborn - Advanced statistical visualizations
  • Jupyter Notebook - Interactive analysis environment